Venice: looking through 100-year data
In the BBC news report “Italy’s plan to save Venice from sinking” in Sept, 2022, it mentions that “Since water levels started being officially recorded in 1923, they have reached 150cm (59in) or more on only 10 occasions, but five of those have been in the last three years.” However, from its cited link, water levels have reached 150cm or more on only 7 occasions, and only one of those has been in the last three years. I found this amazing data dated back to 1924 (100 years ago!) and decided to see what the data tells us.
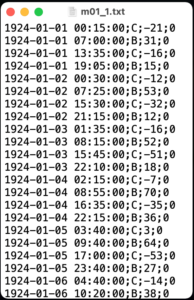
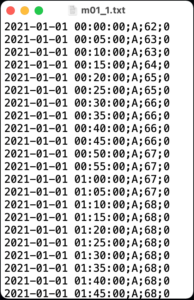
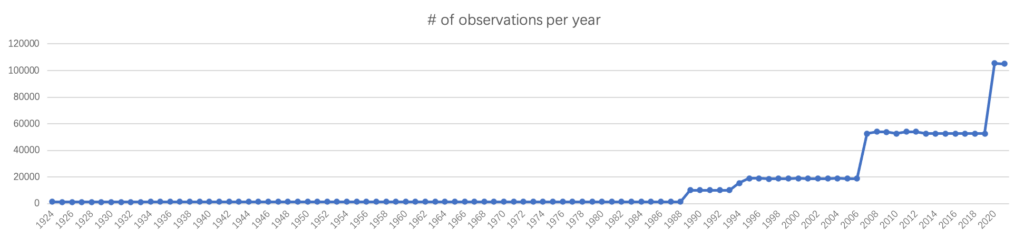
The data is provided by ISPRA (Istituto Superiore per la Protezione e la Ricerca Ambientale in Italian, Higher Institute for Environmental Protection and Research in English). It provides both historical data and real-time data from 27 stations near Venice, Italy. The data has various measurements such as tide, wind, pressure, humidity, rain, temperature, maximum wave, wave period, and solar radiation. I chose to look at the data at Punta della Salute station, which is at the frontier of Grand Canal, the major water-traffic corridors in the city of Venice. This particular dataset of Punta della Salute provides all the historical data from 1924 to 2021. You can also view the real-time data of the current moment, however, you have no access to the recent data.
What does the data say?
Seven occasions with tide more than 150cm. They are year 1951, 1966, 1979, 1986, 2008, 2018, 2019.
| time | tide level (cm) |
|---|---|
| 11/12/1951 8:05:00 AM | 151 |
| 11/4/1966 6:00:00 PM | 194 |
| 12/22/1979 9:10:00 AM | 166 |
| 2/1/1986 3:45:00 AM | 158 |
| 12/1/2008 10:20:00 AM | 155 |
| 10/29/2018 2:40:00 PM | 156 |
| 11/12/2019 10:50:00 PM | 189 |
| 11/15/2019 11:40:00 AM | 156 |
| 11/17/2019 1:10:00 PM | 151 |
My observation from ISPRA data is consistent with the report by city of Venice. I have no idea how BBC gets a totally wrong observations in their report.
What does the data say?
The overall tide trend is increasing in the past 100 years
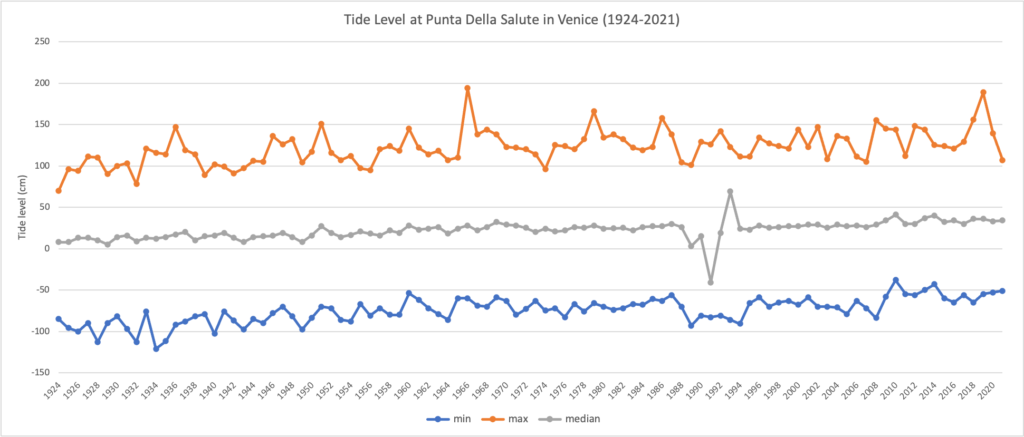
The overall tide is increasing over the years. But the trend seems to be evenly paced increasing. Should a much faster energy consumption in recent years cause a more dramatic change? Is this increasing trend expected?
Also, it seems flood can be caused by one extreme high tide. But drought, as mentioned in another post, may not simply caused by extreme low tides, but rather by a long period of consistent low tides and maybe also low precipitation.
Drought in Venice does not mean tide level is not increasing over the years. But the increase does not mean Venice will be flooded. Only the extreme high tide will flood Venice.